Brasilia Climate & Temperature ⛅

⛳ Brasilia is situated in or near the subtropical moist forest biome.
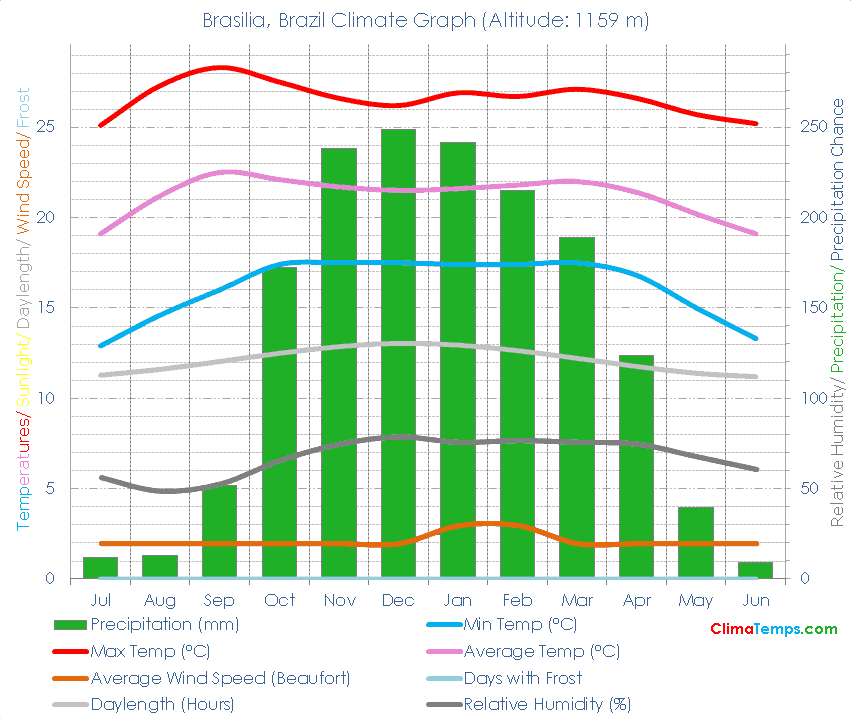
🌡️ The mean temperature is 21.2 degrees Celsius (70.2 degrees Fahrenheit). See the temperatures page for a monthly breakdown and the fixed scale graph.
🐬 Average monthly temperatures vary by 3.4 °C (6.1°F). This indicates that the continentality type is hyperoceanic, subtype truly hyperoceanic.
☔ Total annual precipitation averages 1552.1 mm (61.1 inches) which is equivalent to 1552.1 Litres/m² (38.07 Gallons/ft²).
Embed this graph on your webpage!
Simply paste the following HTML code into your webpage. Please include a link back to this website. There is one in the following code already. Edit the width attribute to change the size of the graph if needed:
✨ The longest day of the year is 12:56 long on the 21 of December and the shortest day is 11:03 long on the 22 of June.
🐇Were you to burrow down through the centre of the Earth from Brasilia you would pop up nearest to the climate station at Tacloban City, Philippines where you would find a Tropical wet climate (Subtropical wet forest biome).
🌍Brasilia, Brazil is at 15°47'S, 47°55'W, 1159 m (3802 ft). Check the location on the map.
Brasilia Climate Table
| Jul | Aug | Sep | Oct | Nov | Dec | Jan | Feb | Mar | Apr | May | Jun | Annual | |
|---|---|---|---|---|---|---|---|---|---|---|---|---|---|
| 25 (77) | 27 (81) | 28 (83) | 28 (82) | 27 (80) | 26 (79) | 27 (80) | 27 (80) | 27 (81) | 27 (80) | 26 (78) | 25 (77) | 27 (80) |
| Jul | Aug | Sep | Oct | Nov | Dec | Jan | Feb | Mar | Apr | May | Jun | Annual | |
|---|---|---|---|---|---|---|---|---|---|---|---|---|---|
| 19 (66) | 21 (70) | 23 (73) | 22 (72) | 22 (71) | 22 (71) | 22 (71) | 22 (71) | 22 (72) | 21 (71) | 20 (68) | 19 (66) | 21 (70) |
| Jul | Aug | Sep | Oct | Nov | Dec | Jan | Feb | Mar | Apr | May | Jun | Annual | |
|---|---|---|---|---|---|---|---|---|---|---|---|---|---|
| 13 (55) | 15 (58) | 16 (61) | 17 (63) | 18 (64) | 18 (64) | 17 (63) | 17 (63) | 18 (64) | 17 (62) | 15 (59) | 13 (56) | 16 (61) |
| Jul | Aug | Sep | Oct | Nov | Dec | Jan | Feb | Mar | Apr | May | Jun | Annual | |
|---|---|---|---|---|---|---|---|---|---|---|---|---|---|
| 12 (0) | 13 (1) | 52 (2) | 172 (7) | 238 (9) | 249 (10) | 241 (10) | 215 (8) | 189 (7) | 124 (5) | 39 (2) | 9 (0) | 1552 (61) |
| Jul | Aug | Sep | Oct | Nov | Dec | Jan | Feb | Mar | Apr | May | Jun | Annual | |
|---|---|---|---|---|---|---|---|---|---|---|---|---|---|
| 11h 16' | 11h 35' | 12h 02' | 12h 29' | 12h 51' | 13h 02' | 12h 56' | 12h 38' | 12h 12' | 11h 45' | 11h 22' | 11h 11' | 12h 00' |
| Jul | Aug | Sep | Oct | Nov | Dec | Jan | Feb | Mar | Apr | May | Jun | Annual | |
|---|---|---|---|---|---|---|---|---|---|---|---|---|---|
| 53.8 | 62.2 | 73.6 | 83.8 | 84.6 | 82.3 | 85.1 | 83.7 | 73.8 | 62.3 | 54 | 50.8 | 70.9 |