Sao Mateus Climate & Temperature ⛅

⛳ Sao Mateus is situated in or near the tropical dry forest biome.
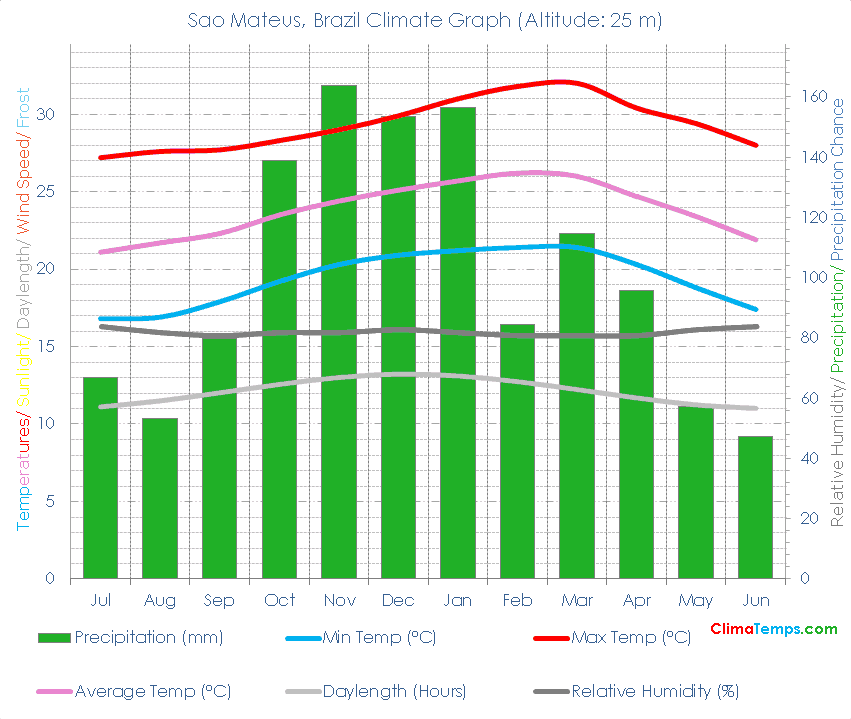
🌡️ The mean temperature is 23.8 degrees Celsius (74.8 degrees Fahrenheit). See the temperatures page for a monthly breakdown and the fixed scale graph.
🐬 Average monthly temperatures vary by 5.1 °C (9.2°F). This indicates that the continentality type is hyperoceanic, subtype truly hyperoceanic.
☔ Total annual precipitation averages 1211.5 mm (47.7 inches) which is equivalent to 1211.5 Litres/m² (29.72 Gallons/ft²).
Embed this graph on your webpage!
Simply paste the following HTML code into your webpage. Please include a link back to this website. There is one in the following code already. Edit the width attribute to change the size of the graph if needed:
✨ The longest day of the year is 13:07 long on the 21 of December and the shortest day is 10:52 long on the 22 of June.
🐇Were you to burrow down through the centre of the Earth from Sao Mateus you would pop up nearest to the climate station at Guam, Mariana Islands where you would find a Tropical wet climate.
🌍Sao Mateus, Brazil is at 18°42'S, 39°51'W, 25 m (82 ft). Check the location on the map.
Sao Mateus Climate Table
| Jul | Aug | Sep | Oct | Nov | Dec | Jan | Feb | Mar | Apr | May | Jun | Annual | |
|---|---|---|---|---|---|---|---|---|---|---|---|---|---|
| 27 (81) | 28 (82) | 28 (82) | 28 (83) | 29 (84) | 30 (86) | 31 (88) | 32 (89) | 32 (90) | 30 (87) | 29 (85) | 28 (82) | 29 (85) |
| Jul | Aug | Sep | Oct | Nov | Dec | Jan | Feb | Mar | Apr | May | Jun | Annual | |
|---|---|---|---|---|---|---|---|---|---|---|---|---|---|
| 21 (70) | 22 (71) | 22 (72) | 24 (74) | 24 (76) | 25 (77) | 26 (78) | 26 (79) | 26 (79) | 25 (76) | 23 (74) | 22 (71) | 24 (75) |
| Jul | Aug | Sep | Oct | Nov | Dec | Jan | Feb | Mar | Apr | May | Jun | Annual | |
|---|---|---|---|---|---|---|---|---|---|---|---|---|---|
| 17 (62) | 17 (62) | 18 (64) | 19 (67) | 20 (69) | 21 (70) | 21 (70) | 21 (71) | 21 (71) | 20 (69) | 19 (66) | 17 (63) | 19 (67) |
| Jul | Aug | Sep | Oct | Nov | Dec | Jan | Feb | Mar | Apr | May | Jun | Annual | |
|---|---|---|---|---|---|---|---|---|---|---|---|---|---|
| 67 (3) | 53 (2) | 80 (3) | 139 (5) | 164 (6) | 153 (6) | 157 (6) | 84 (3) | 115 (5) | 96 (4) | 57 (2) | 47 (2) | 1212 (48) |
| Jul | Aug | Sep | Oct | Nov | Dec | Jan | Feb | Mar | Apr | May | Jun | Annual | |
|---|---|---|---|---|---|---|---|---|---|---|---|---|---|
| 11h 06' | 11h 29' | 12h 01' | 12h 33' | 13h 00' | 13h 13' | 13h 06' | 12h 44' | 12h 13' | 11h 41' | 11h 14' | 11h 00' | 12h 00' |
| Jul | Aug | Sep | Oct | Nov | Dec | Jan | Feb | Mar | Apr | May | Jun | Annual | |
|---|---|---|---|---|---|---|---|---|---|---|---|---|---|
| 50.9 | 59.3 | 70.7 | 81.3 | 86.4 | 85.2 | 87.1 | 81.1 | 70.9 | 59.3 | 51.1 | 47.9 | 69.3 |