> > Canada > Kugluktuk/ Coppermine, Nunavut

Canada flag

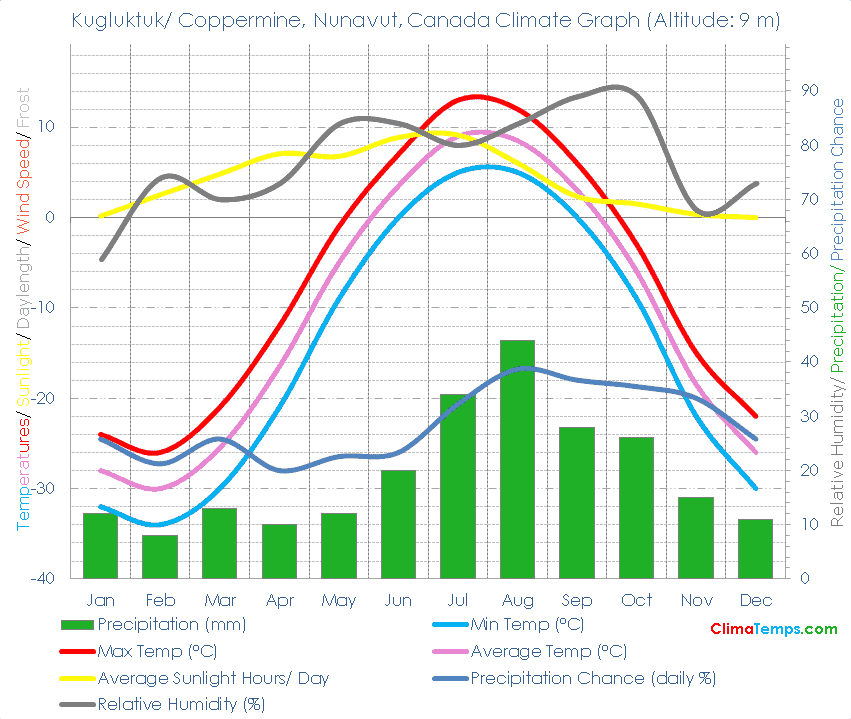
Kugluktuk/ Coppermine, Nunavut Climate & Temperature

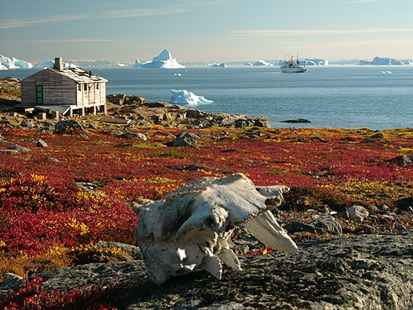
⛺ Kugluktuk/ Coppermine, Nunavut has a polar tundra climate with no true summer (Köppen-Geiger classification: ET).tundra climate (ET)

⛳ Kugluktuk/ Coppermine, Nunavut is situated in or near the subpolar wet tundra biome.

🌡️ The average annual temperature is -11 degrees Celsius (12.3 degrees Fahrenheit). See the temperatures page for a monthly breakdown and the fixed scale graph.

🐬 Average monthly temperatures vary by 39 °C (70.2°F). This indicates that the continentality type is continental, subtype truly continental.

☔ Total annual precipitation averages 233 mm (9.2 inches) which is equivalent to 233 Litres/m² (5.71 Gallons/ft²).

Kugluktuk/ Coppermine, Nunavut Climate Graph

Embed this graph on your webpage!

Simply paste the following HTML code into your webpage. Please include a link back to this website. There is one in the following code already. Edit the width attribute to change the size of the graph if needed:

🐇Were you to burrow down through the centre of the Earth from Kugluktuk/ Coppermine, Nunavut you would pop up nearest to the climate station at Davis, Antarctica where you would find a Tundra climate.

🌍Kugluktuk/ Coppermine, Nunavut, Canada is at 67°49'N, 115°4'W, 9 m (30 ft). Check the location on the map.

Kugluktuk/ Coppermine, Nunavut Climate Table

Average Max Temperature °C ( °F)
Jan Feb Mar Apr May Jun Jul Aug Sep Oct Nov Dec Annual
-24 (-11) -26 (-15) -21 (-6) -12 (10) -1 (30) 7 (45) 13 (55) 12 (54) 6 (43) -3 (27) -15 (5) -22 (-8) -7 (19)
Average Temperature °C ( °F)
Jan Feb Mar Apr May Jun Jul Aug Sep Oct Nov Dec Annual
-28 (-18) -30 (-22) -26 (-14) -17 (2) -5 (23) 4 (38) 9 (48) 9 (47) 3 (37) -6 (21) -19 (-1) -26 (-15) -11 (12)
Average Min Temperature °C ( °F)
Jan Feb Mar Apr May Jun Jul Aug Sep Oct Nov Dec Annual
-32 (-26) -34 (-29) -30 (-22) -21 (-6) -9 (16) 0 (32) 5 (41) 5 (41) 0 (32) -9 (16) -22 (-8) -30 (-22) -15 (5)
Average Precipitation mm (in)
Jan Feb Mar Apr May Jun Jul Aug Sep Oct Nov Dec Annual
12 (0) 8 (0) 13 (1) 10 (0) 12 (0) 20 (1) 34 (1) 44 (2) 28 (1) 26 (1) 15 (1) 11 (0) 233 (9)
Number of Wet Days (probability of rain on a day %)
Jan Feb Mar Apr May Jun Jul Aug Sep Oct Nov Dec Annual
8 (26) 6 (21) 8 (26) 6 (20) 7 (23) 7 (23) 10 (32) 12 (39) 11 (37) 11 (35) 10 (33) 8 (26) 104 (28)
Average Sunlight Hours/ Day
Jan Feb Mar Apr May Jun Jul Aug Sep Oct Nov Dec Annual
0h 09' 2h 45' 4h 48' 7h 18' 6h 46' 9h 10' 9h 07' 6h 01' 2h 24' 1h 30' 0h 22' 0h 00' 4h 12'
Average Daylight Hours/ Day
Jan Feb Mar Apr May Jun Jul Aug Sep Oct Nov Dec Annual
3h 06' 7h 59' 11h 59' 16h 04' 20h 34' 0h 46' 22h 48' 17h 42' 13h 33' 9h 28' 4h 56' 0h 52' 12h 00'
Sun altitude at solar noon on the 21st day (°).
Jan Feb Mar Apr May Jun Jul Aug Sep Oct Nov Dec Annual
2.6 11.9 22.7 34.2 42.5 45.6 42.6 34.1 22.7 11.3 2.4 -1 22.6


Homepage