Camilo Daza Climate & Temperature ⛅
⛳ Camilo Daza is situated in or near the subtropical wet forest biome.
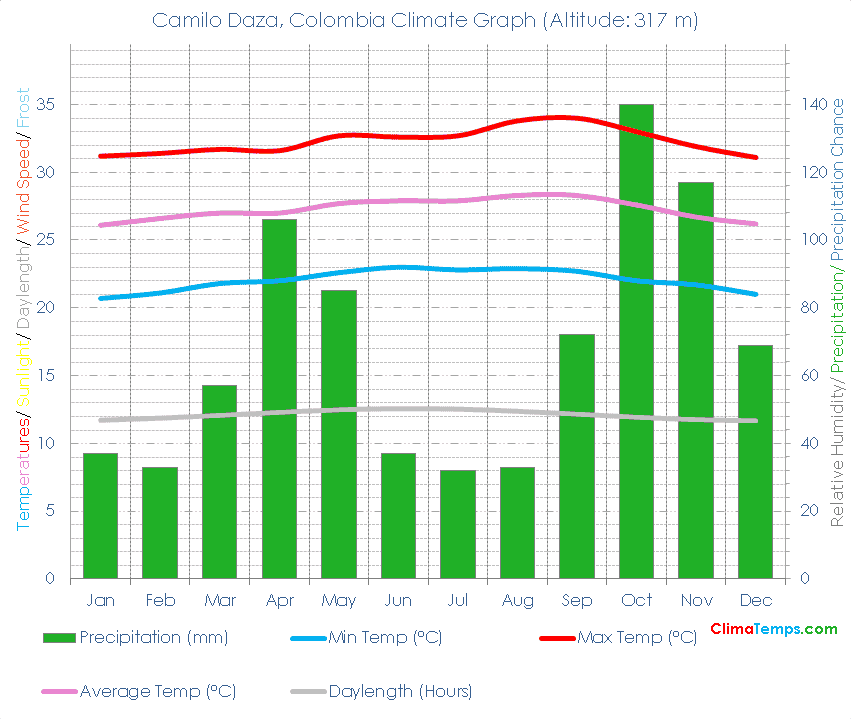
🌡️ The mean temperature is 27.3 degrees Celsius (81.1 degrees Fahrenheit). See the temperatures page for a monthly breakdown and the fixed scale graph.
🐬 Average monthly temperatures vary by 2.2 °C (4°F). This indicates that the continentality type is hyperoceanic, subtype extremely hyperoceanic.
☔ Total annual precipitation averages 818 mm (32.2 inches) which is equivalent to 818 Litres/m² (20.06 Gallons/ft²).
Embed this graph on your webpage!
Simply paste the following HTML code into your webpage. Please include a link back to this website. There is one in the following code already. Edit the width attribute to change the size of the graph if needed:
✨ The longest day of the year is 12:27 long on the 22 of June and the shortest day is 11:32 long on the 21 of December.
🐇Were you to burrow down through the centre of the Earth from Camilo Daza you would pop up nearest to the climate station at Jakarta, Java, Indonesia where you would find a Tropical monsoonal climate (Subtropical moist forest biome).
🌍Camilo Daza, Colombia is at 7°56'N, 72°30'W, 317 m (1040 ft). Check the location on the map.
Camilo Daza Climate Table
| Jan | Feb | Mar | Apr | May | Jun | Jul | Aug | Sep | Oct | Nov | Dec | Annual | |
|---|---|---|---|---|---|---|---|---|---|---|---|---|---|
| 31 (88) | 31 (89) | 32 (89) | 32 (89) | 33 (91) | 33 (91) | 33 (91) | 34 (93) | 34 (93) | 33 (91) | 32 (89) | 31 (88) | 32 (90) |
| Jan | Feb | Mar | Apr | May | Jun | Jul | Aug | Sep | Oct | Nov | Dec | Annual | |
|---|---|---|---|---|---|---|---|---|---|---|---|---|---|
| 26 (79) | 27 (80) | 27 (81) | 27 (81) | 28 (82) | 28 (82) | 28 (82) | 28 (83) | 28 (83) | 28 (82) | 27 (80) | 26 (79) | 27 (81) |
| Jan | Feb | Mar | Apr | May | Jun | Jul | Aug | Sep | Oct | Nov | Dec | Annual | |
|---|---|---|---|---|---|---|---|---|---|---|---|---|---|
| 21 (69) | 21 (70) | 22 (71) | 22 (72) | 23 (73) | 23 (73) | 23 (73) | 23 (73) | 23 (73) | 22 (72) | 22 (71) | 21 (70) | 22 (72) |
| Jan | Feb | Mar | Apr | May | Jun | Jul | Aug | Sep | Oct | Nov | Dec | Annual | |
|---|---|---|---|---|---|---|---|---|---|---|---|---|---|
| 37 (1) | 33 (1) | 57 (2) | 106 (4) | 85 (3) | 37 (1) | 32 (1) | 33 (1) | 72 (3) | 140 (6) | 117 (5) | 69 (3) | 818 (32) |
| Jan | Feb | Mar | Apr | May | Jun | Jul | Aug | Sep | Oct | Nov | Dec | Annual | |
|---|---|---|---|---|---|---|---|---|---|---|---|---|---|
| 11h 42' | 11h 51' | 12h 04' | 12h 17' | 12h 28' | 12h 34' | 12h 31' | 12h 22' | 12h 09' | 11h 56' | 11h 45' | 11h 39' | 12h 00' |
| Jan | Feb | Mar | Apr | May | Jun | Jul | Aug | Sep | Oct | Nov | Dec | Annual | |
|---|---|---|---|---|---|---|---|---|---|---|---|---|---|
| 62.1 | 71.4 | 82.3 | 85.9 | 77.6 | 74.5 | 77.5 | 85.9 | 82.4 | 70.8 | 61.9 | 58.6 | 74.3 |