Le Lamentin Climate & Temperature ⛅

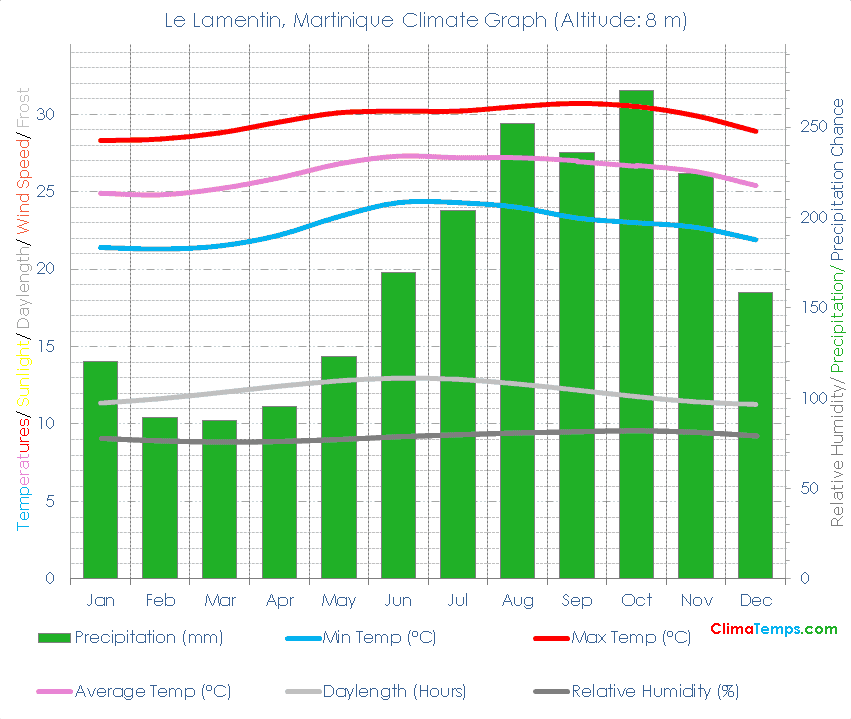
🌡️ The mean annual temperature is 26.2 degrees Celsius (79.2 degrees Fahrenheit). See the temperatures page for a monthly breakdown and the fixed scale graph.
🐬 Average monthly temperatures vary by 2.5 °C (4.5°F). This indicates that the continentality type is hyperoceanic, subtype extremely hyperoceanic.
☔ Total annual precipitation averages 2030.3 mm (79.9 inches) which is equivalent to 2030.3 Litres/m² (49.8 Gallons/ft²).
Embed this graph on your webpage!
Simply paste the following HTML code into your webpage. Please include a link back to this website. There is one in the following code already. Edit the width attribute to change the size of the graph if needed:
✨ The longest day of the year is 12:51 long on the 22 of June and the shortest day is 11:08 long on the 21 of December.
🐇Were you to burrow down through the centre of the Earth from Le Lamentin you would pop up nearest to the climate station at Broome, Western Australia, Australia (Tropical very dry forest biome).
🌍Le Lamentin, Martinique is at 14°35'N, 60°59'W, 8 m (26 ft). Check the location on the map.
Le Lamentin Climate Table
| Jan | Feb | Mar | Apr | May | Jun | Jul | Aug | Sep | Oct | Nov | Dec | Annual | |
|---|---|---|---|---|---|---|---|---|---|---|---|---|---|
| 28 (83) | 28 (83) | 29 (84) | 30 (85) | 30 (86) | 30 (86) | 30 (86) | 31 (87) | 31 (87) | 31 (87) | 30 (86) | 29 (84) | 30 (85) |
| Jan | Feb | Mar | Apr | May | Jun | Jul | Aug | Sep | Oct | Nov | Dec | Annual | |
|---|---|---|---|---|---|---|---|---|---|---|---|---|---|
| 25 (77) | 25 (77) | 25 (77) | 26 (79) | 27 (80) | 27 (81) | 27 (81) | 27 (81) | 27 (81) | 27 (80) | 26 (79) | 25 (78) | 26 (79) |
| Jan | Feb | Mar | Apr | May | Jun | Jul | Aug | Sep | Oct | Nov | Dec | Annual | |
|---|---|---|---|---|---|---|---|---|---|---|---|---|---|
| 21 (71) | 21 (70) | 22 (71) | 22 (72) | 23 (74) | 24 (76) | 24 (76) | 24 (75) | 23 (74) | 23 (73) | 23 (73) | 22 (71) | 23 (73) |
| Jan | Feb | Mar | Apr | May | Jun | Jul | Aug | Sep | Oct | Nov | Dec | Annual | |
|---|---|---|---|---|---|---|---|---|---|---|---|---|---|
| 121 (5) | 89 (4) | 88 (3) | 96 (4) | 123 (5) | 170 (7) | 204 (8) | 252 (10) | 236 (9) | 270 (11) | 224 (9) | 159 (6) | 2030 (80) |
| Jan | Feb | Mar | Apr | May | Jun | Jul | Aug | Sep | Oct | Nov | Dec | Annual | |
|---|---|---|---|---|---|---|---|---|---|---|---|---|---|
| 11h 21' | 11h 38' | 12h 01' | 12h 26' | 12h 47' | 12h 57' | 12h 53' | 12h 35' | 12h 11' | 11h 46' | 11h 25' | 11h 16' | 12h 00' |
| Jan | Feb | Mar | Apr | May | Jun | Jul | Aug | Sep | Oct | Nov | Dec | Annual | |
|---|---|---|---|---|---|---|---|---|---|---|---|---|---|
| 55.5 | 64.8 | 75.7 | 87.4 | 84.3 | 81.2 | 84 | 87.3 | 75.9 | 64.3 | 55.3 | 52 | 72.3 |