Yap Island/ Caroline Islands Climate & Temperature ⛅

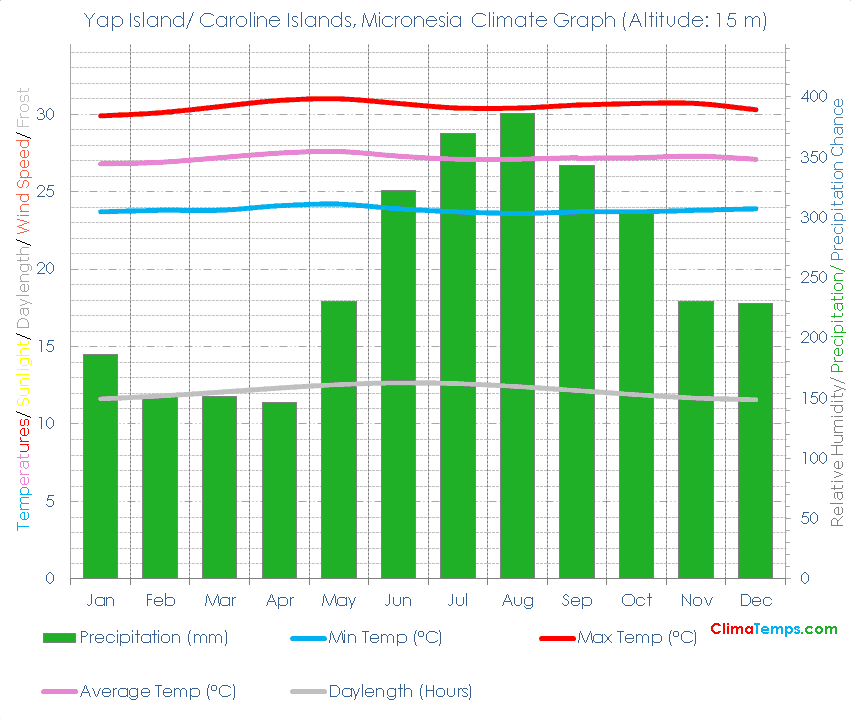
🌡️ The mean annual temperature is 27.2 degrees Celsius (81 degrees Fahrenheit). See the temperatures page for a monthly breakdown and the fixed scale graph.
🐬 Average monthly temperatures vary by 0.800000000000001 °C (1.4°F). This indicates that the continentality type is hyperoceanic, subtype extremely hyperoceanic.
☔ Total annual precipitation averages 3049.5 mm (120.1 inches) which is equivalent to 3049.5 Litres/m² (74.8 Gallons/ft²).
Embed this graph on your webpage!
Simply paste the following HTML code into your webpage. Please include a link back to this website. There is one in the following code already. Edit the width attribute to change the size of the graph if needed:
✨ The longest day of the year is 12:33 long on the 22 of June and the shortest day is 11:26 long on the 21 of December.
🐇Were you to burrow down through the centre of the Earth from Yap Island/ Caroline Islands you would pop up nearest to the climate station at Remanso, Brazil (Subtropical dry forest biome).
🌍Yap Island/ Caroline Islands, Micronesia is at 9°29'N, 138°4'E, 15 m (49 ft). Check the location on the map.
Yap Island/ Caroline Islands Climate Table
| Jan | Feb | Mar | Apr | May | Jun | Jul | Aug | Sep | Oct | Nov | Dec | Annual | |
|---|---|---|---|---|---|---|---|---|---|---|---|---|---|
| 30 (86) | 30 (86) | 31 (87) | 31 (88) | 31 (88) | 31 (87) | 30 (87) | 30 (87) | 31 (87) | 31 (87) | 31 (87) | 30 (87) | 31 (87) |
| Jan | Feb | Mar | Apr | May | Jun | Jul | Aug | Sep | Oct | Nov | Dec | Annual | |
|---|---|---|---|---|---|---|---|---|---|---|---|---|---|
| 27 (80) | 27 (80) | 27 (81) | 28 (82) | 28 (82) | 27 (81) | 27 (81) | 27 (81) | 27 (81) | 27 (81) | 27 (81) | 27 (81) | 27 (81) |
| Jan | Feb | Mar | Apr | May | Jun | Jul | Aug | Sep | Oct | Nov | Dec | Annual | |
|---|---|---|---|---|---|---|---|---|---|---|---|---|---|
| 24 (75) | 24 (75) | 24 (75) | 24 (75) | 24 (76) | 24 (75) | 24 (75) | 24 (74) | 24 (75) | 24 (75) | 24 (75) | 24 (75) | 24 (75) |
| Jan | Feb | Mar | Apr | May | Jun | Jul | Aug | Sep | Oct | Nov | Dec | Annual | |
|---|---|---|---|---|---|---|---|---|---|---|---|---|---|
| 186 (7) | 152 (6) | 151 (6) | 146 (6) | 230 (9) | 322 (13) | 369 (15) | 386 (15) | 343 (14) | 304 (12) | 230 (9) | 228 (9) | 3050 (120) |
| Jan | Feb | Mar | Apr | May | Jun | Jul | Aug | Sep | Oct | Nov | Dec | Annual | |
|---|---|---|---|---|---|---|---|---|---|---|---|---|---|
| 11h 37' | 11h 48' | 12h 03' | 12h 19' | 12h 33' | 12h 39' | 12h 36' | 12h 25' | 12h 09' | 11h 53' | 11h 40' | 11h 34' | 12h 00' |
| Jan | Feb | Mar | Apr | May | Jun | Jul | Aug | Sep | Oct | Nov | Dec | Annual | |
|---|---|---|---|---|---|---|---|---|---|---|---|---|---|
| 60.4 | 69.6 | 80.5 | 87.7 | 79.3 | 76.1 | 78.9 | 87.2 | 81.1 | 69.5 | 60.4 | 57.1 | 74 |