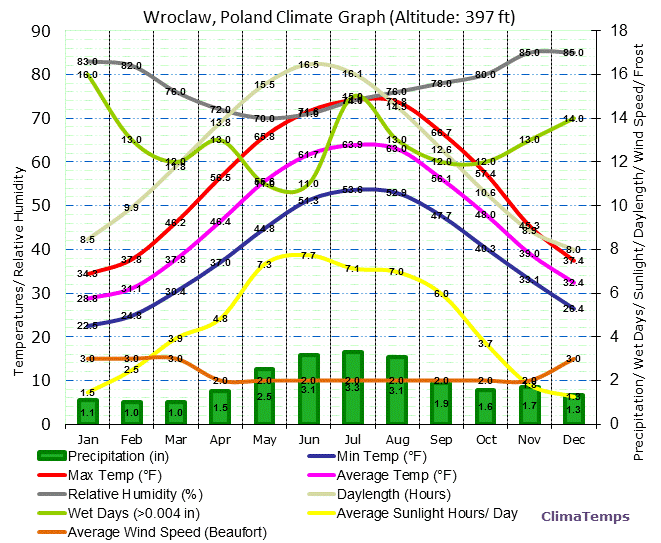
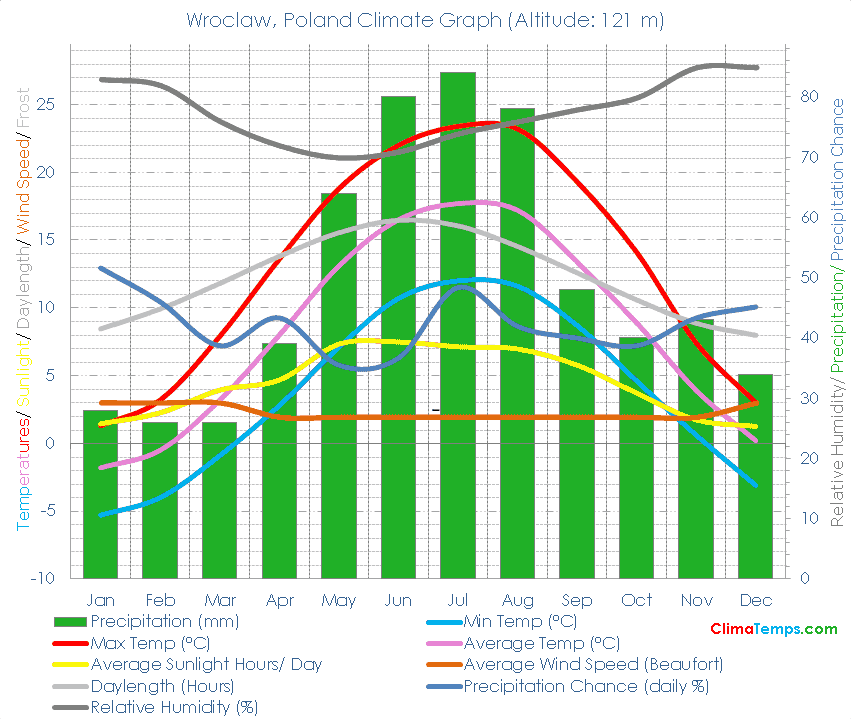
Wroclaw, Poland Climate Graphs
The first graph shows the climate in Wroclaw, Poland in metric units and the second in English units. The climate graphs depict monthly average temperatures, precipitation, wet days, sunlight hours, relative humidity and wind speed.
Wroclaw, Poland Climate Graph in Metric Units
Wroclaw, Poland Climograph in English Units