Timisoara Climate & Temperature ⛅
⛳ Timisoara is situated in or near the cool temperate moist forest biome.
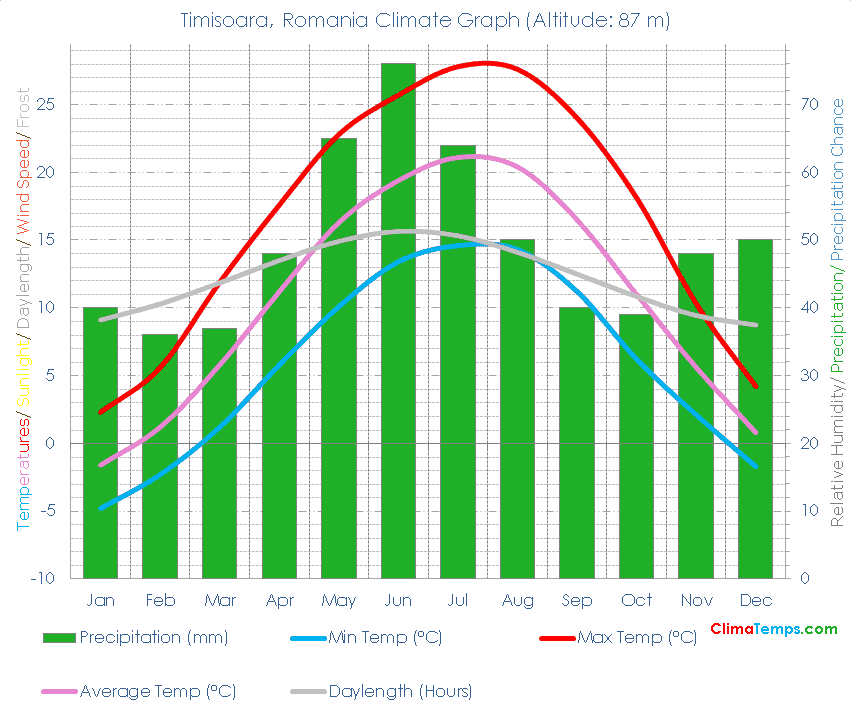
🌡️ The mean temperature is 10.6 degrees Celsius (51.1 degrees Fahrenheit). See the temperatures page for a monthly breakdown and the fixed scale graph.
🐬 Average monthly temperatures vary by 22.7 °C (40.9°F). This indicates that the continentality type is continental, subtype subcontinental.
☔ Total annual precipitation averages 593 mm (23.3 inches) which is equivalent to 593 Litres/m² (14.54 Gallons/ft²).
Embed this graph on your webpage!
Simply paste the following HTML code into your webpage. Please include a link back to this website. There is one in the following code already. Edit the width attribute to change the size of the graph if needed:
In the winter time records indicate temperatures by day reach 4°C (39.3°F) on average falling to -2.9°C (26.7°F) overnight.
In spring time temperatures climb reaching 17.4°C (63.4°F) generally in the afternoon with overnight lows of 5.7°C (42.3°F).
During summer average high temperatures are 27°C (80.7°F) and average low temperatures are 14.1°C (57.4°F).
Come autumn/ fall temperatures decrease achieving average highs of 17.5°C (63.4°F) during the day and lows of 6.5°C (43.7°F) generally shortly after sunrise.
✨ The longest day of the year is 15:31 long on the 22 of June and the shortest day is 8:28 long on the 21 of December.
🐇Were you to burrow down through the centre of the Earth from Timisoara you would pop up nearest to the climate station at Mokairau, Pakarae, New Zealand (Warm temperate thorn steppe biome).
🌍Timisoara, Romania is at 45°46'N, 21°15'E, 87 m (286 ft). Check the location on the map.
Timisoara Climate Table
| Jan | Feb | Mar | Apr | May | Jun | Jul | Aug | Sep | Oct | Nov | Dec | Annual | |
|---|---|---|---|---|---|---|---|---|---|---|---|---|---|
| 2 (36) | 6 (42) | 12 (53) | 18 (64) | 23 (73) | 26 (78) | 28 (82) | 28 (82) | 24 (75) | 18 (65) | 10 (51) | 4 (40) | 17 (62) |
| Jan | Feb | Mar | Apr | May | Jun | Jul | Aug | Sep | Oct | Nov | Dec | Annual | |
|---|---|---|---|---|---|---|---|---|---|---|---|---|---|
| -2 (29) | 1 (34) | 6 (42) | 11 (52) | 16 (61) | 19 (67) | 21 (70) | 20 (69) | 17 (62) | 11 (52) | 6 (42) | 1 (33) | 11 (51) |
| Jan | Feb | Mar | Apr | May | Jun | Jul | Aug | Sep | Oct | Nov | Dec | Annual | |
|---|---|---|---|---|---|---|---|---|---|---|---|---|---|
| -5 (23) | -2 (28) | 1 (34) | 6 (42) | 10 (50) | 13 (56) | 15 (58) | 14 (58) | 11 (52) | 6 (43) | 2 (36) | -2 (29) | 6 (43) |
| Jan | Feb | Mar | Apr | May | Jun | Jul | Aug | Sep | Oct | Nov | Dec | Annual | |
|---|---|---|---|---|---|---|---|---|---|---|---|---|---|
| 40 (2) | 36 (1) | 37 (1) | 48 (2) | 65 (3) | 76 (3) | 64 (3) | 50 (2) | 40 (2) | 39 (2) | 48 (2) | 50 (2) | 593 (23) |
| Jan | Feb | Mar | Apr | May | Jun | Jul | Aug | Sep | Oct | Nov | Dec | Annual | |
|---|---|---|---|---|---|---|---|---|---|---|---|---|---|
| 9h 06' | 10h 17' | 11h 50' | 13h 29' | 14h 54' | 15h 38' | 15h 19' | 14h 05' | 12h 29' | 10h 50' | 9h 26' | 8h 43' | 12h 00' |
| Jan | Feb | Mar | Apr | May | Jun | Jul | Aug | Sep | Oct | Nov | Dec | Annual | |
|---|---|---|---|---|---|---|---|---|---|---|---|---|---|
| 24.3 | 33.7 | 44.5 | 56.1 | 64.4 | 67.7 | 64.6 | 56.3 | 44.9 | 33.4 | 24.2 | 20.8 | 44.5 |