Santis Climate & Temperature ⛅
⛳ Santis is situated in or near the cool temperate wet forest biome.
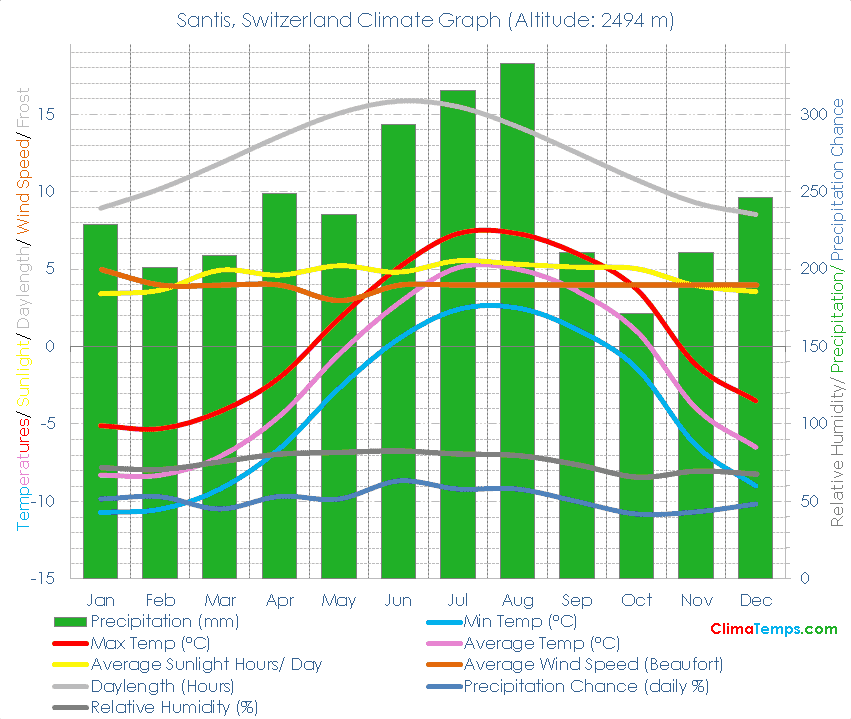
🌡️ The average annual temperature is -1.7 degrees Celsius (28.9 degrees Fahrenheit). See the temperatures page for a monthly breakdown and the fixed scale graph.
🐬 Average monthly temperatures vary by 13.4 °C (24.1°F). This indicates that the continentality type is oceanic, subtype truly oceanic.
☔ Total annual precipitation averages 2903 mm (114.3 inches) which is equivalent to 2903 Litres/m² (71.2 Gallons/ft²).
Embed this graph on your webpage!
Simply paste the following HTML code into your webpage. Please include a link back to this website. There is one in the following code already. Edit the width attribute to change the size of the graph if needed:
✨ The longest day of the year is 15:43 long on the 22 of June and the shortest day is 8:16 long on the 21 of December.
🌞 On average there are 1710 hours of sunshine per year. Visit the sunshine and daylight section to check monthly details including how high in the sky the sun reaches each month.
🐇Were you to burrow down through the centre of the Earth from Santis you would pop up nearest to the climate station at Te Wharau, Glenburn, New Zealand (Warm temperate thorn steppe biome).
🌍Santis, Switzerland is at 47°14'N, 9°20'E, 2494 m (8183 ft). Check the location on the map.
Santis Climate Table
| Jan | Feb | Mar | Apr | May | Jun | Jul | Aug | Sep | Oct | Nov | Dec | Annual | |
|---|---|---|---|---|---|---|---|---|---|---|---|---|---|
| -5 (23) | -5 (22) | -4 (24) | -2 (28) | 2 (35) | 5 (41) | 7 (45) | 7 (45) | 6 (43) | 4 (39) | -1 (30) | -4 (26) | 1 (33) |
| Jan | Feb | Mar | Apr | May | Jun | Jul | Aug | Sep | Oct | Nov | Dec | Annual | |
|---|---|---|---|---|---|---|---|---|---|---|---|---|---|
| -8 (17) | -8 (17) | -7 (19) | -5 (24) | -1 (31) | 3 (37) | 5 (41) | 5 (41) | 4 (38) | 1 (34) | -4 (25) | -7 (20) | -2 (29) |
| Jan | Feb | Mar | Apr | May | Jun | Jul | Aug | Sep | Oct | Nov | Dec | Annual | |
|---|---|---|---|---|---|---|---|---|---|---|---|---|---|
| -11 (13) | -11 (13) | -9 (15) | -7 (20) | -3 (27) | 1 (33) | 2 (36) | 3 (37) | 1 (34) | -1 (29) | -6 (20) | -9 (16) | -4 (25) |
| Jan | Feb | Mar | Apr | May | Jun | Jul | Aug | Sep | Oct | Nov | Dec | Annual | |
|---|---|---|---|---|---|---|---|---|---|---|---|---|---|
| 229 (9) | 201 (8) | 209 (8) | 249 (10) | 235 (9) | 293 (12) | 315 (12) | 333 (13) | 211 (8) | 171 (7) | 211 (8) | 246 (10) | 2903 (114) |
| Jan | Feb | Mar | Apr | May | Jun | Jul | Aug | Sep | Oct | Nov | Dec | Annual | |
|---|---|---|---|---|---|---|---|---|---|---|---|---|---|
| 16 (52) | 15 (53) | 14 (45) | 16 (53) | 16 (52) | 19 (63) | 18 (58) | 18 (58) | 15 (50) | 13 (42) | 13 (43) | 15 (48) | 188 (51) |
| Jan | Feb | Mar | Apr | May | Jun | Jul | Aug | Sep | Oct | Nov | Dec | Annual | |
|---|---|---|---|---|---|---|---|---|---|---|---|---|---|
| 3h 25' | 4h 00' | 4h 56' | 4h 46' | 5h 13' | 4h 58' | 5h 32' | 5h 19' | 5h 18' | 5h 01' | 4h 04' | 3h 32' | 4h 40' |
| Jan | Feb | Mar | Apr | May | Jun | Jul | Aug | Sep | Oct | Nov | Dec | Annual | |
|---|---|---|---|---|---|---|---|---|---|---|---|---|---|
| 8h 56' | 10h 11' | 11h 49' | 13h 34' | 15h 03' | 15h 50' | 15h 29' | 14h 11' | 12h 30' | 10h 45' | 9h 16' | 8h 32' | 12h 00' |
| Jan | Feb | Mar | Apr | May | Jun | Jul | Aug | Sep | Oct | Nov | Dec | Annual | |
|---|---|---|---|---|---|---|---|---|---|---|---|---|---|
| 39 (61) | 40 (60) | 42 (58) | 36 (64) | 35 (65) | 32 (68) | 36 (64) | 38 (62) | 43 (57) | 48 (52) | 45 (55) | 43 (57) | 39 (61) |
| Jan | Feb | Mar | Apr | May | Jun | Jul | Aug | Sep | Oct | Nov | Dec | Annual | |
|---|---|---|---|---|---|---|---|---|---|---|---|---|---|
| 22.9 | 32.2 | 43 | 54.7 | 63 | 66.2 | 63.2 | 54.8 | 43.4 | 31.9 | 22.8 | 19.4 | 43.1 |