> > Peru > Lima

Peru flag

Lima Climate & Temperature

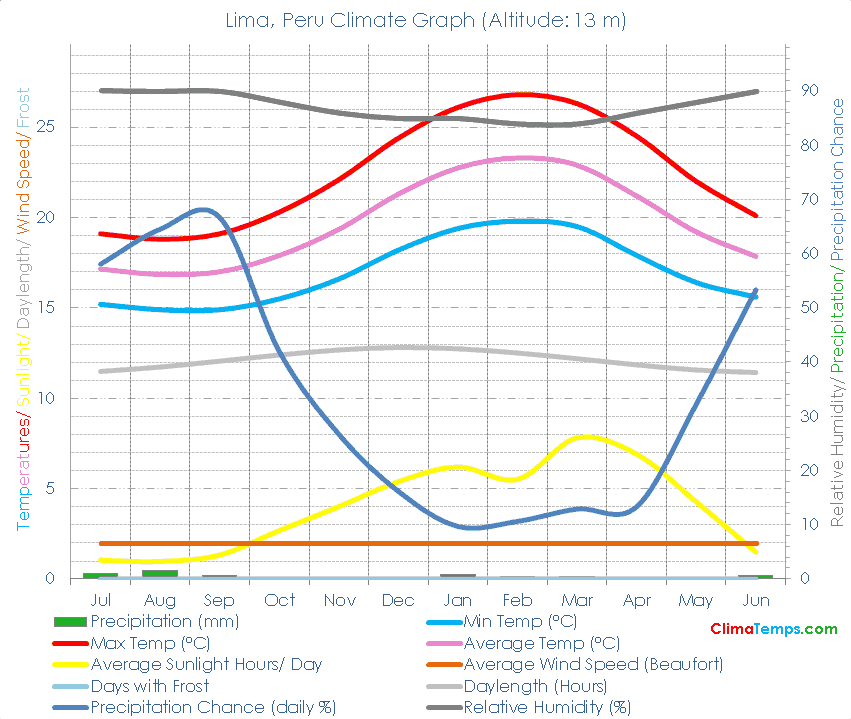
⛺ Lima has a subtropical desert / low-latitude arid hot climate (Köppen-Geiger classification: BWh)subtropical hot desert climate (BWh)

🌡️ The annual average temperature is 19.7 degrees Celsius (67.5 degrees Fahrenheit). See the temperatures page for a monthly breakdown and the fixed scale graph.

🐬 Average monthly temperatures vary by 6.45 °C (11.6°F). This indicates that the continentality type is hyperoceanic, subtype truly hyperoceanic.

☔ Total annual precipitation averages 6.4 mm (0.3 inches) which is equivalent to 6.4 Litres/m² (0.16 Gallons/ft²).

Lima Climate Graph

Embed this graph on your webpage!

Simply paste the following HTML code into your webpage. Please include a link back to this website. There is one in the following code already. Edit the width attribute to change the size of the graph if needed:

✨ The longest day of the year is 12:42 long on the 21 of December and the shortest day is 11:17 long on the 22 of June.

🌞 On average there are 1474 hours of sunshine per year. Visit the sunshine and daylight section to check monthly details including how high in the sky the sun reaches each month.

🐇Were you to burrow down through the centre of the Earth from Lima you would pop up nearest to the climate station at Khlong Yai, Thailand where you would find a Tropical monsoonal climate.

🌍Lima, Peru is at 12°1'S, 77°6'W, 13 m (43 ft). Check the location on the map.

Lima Climate Table

Average Max Temperature °C ( °F)
Jul Aug Sep Oct Nov Dec Jan Feb Mar Apr May Jun Annual
19 (66) 19 (66) 19 (66) 20 (69) 22 (72) 24 (76) 26 (79) 27 (80) 26 (79) 25 (76) 22 (72) 20 (68) 23 (72)
Average Temperature °C ( °F)
Jul Aug Sep Oct Nov Dec Jan Feb Mar Apr May Jun Annual
17 (63) 17 (62) 17 (63) 18 (64) 19 (67) 21 (70) 23 (73) 23 (74) 23 (73) 21 (70) 19 (67) 18 (64) 20 (68)
Average Min Temperature °C ( °F)
Jul Aug Sep Oct Nov Dec Jan Feb Mar Apr May Jun Annual
15 (59) 15 (59) 15 (59) 16 (60) 17 (62) 18 (65) 19 (67) 20 (68) 20 (67) 18 (64) 16 (62) 16 (60) 17 (63)
Average Precipitation mm (in)
Jul Aug Sep Oct Nov Dec Jan Feb Mar Apr May Jun Annual
1 (0) 2 (0) 1 (0) 0 (0) 0 (0) 0 (0) 1 (0) 0 (0) 0 (0) 0 (0) 0 (0) 1 (0) 6 (0)
Number of Wet Days (probability of rain on a day %)
Jul Aug Sep Oct Nov Dec Jan Feb Mar Apr May Jun Annual
18 (58) 20 (65) 20 (67) 13 (42) 8 (27) 5 (16) 3 (10) 3 (11) 4 (13) 4 (13) 10 (32) 16 (53) 124 (34)
Average Sunlight Hours/ Day
Jul Aug Sep Oct Nov Dec Jan Feb Mar Apr May Jun Annual
1h 01' 0h 58' 1h 22' 2h 40' 4h 08' 5h 23' 6h 11' 6h 03' 7h 48' 7h 08' 4h 15' 1h 32' 4h 02'
Average Daylight Hours/ Day
Jul Aug Sep Oct Nov Dec Jan Feb Mar Apr May Jun Annual
11h 29' 11h 43' 12h 03' 12h 23' 12h 40' 12h 48' 12h 44' 12h 30' 12h 11' 11h 50' 11h 33' 11h 25' 12h 00'
Percentage of Sunny (Cloudy) Daylight Hours
Jul Aug Sep Oct Nov Dec Jan Feb Mar Apr May Jun Annual
9 (91) 8 (92) 11 (89) 22 (78) 33 (67) 42 (58) 49 (51) 49 (51) 65 (35) 61 (39) 37 (63) 14 (86) 34 (66)
Sun altitude at solar noon on the 21st day (°).
Jul Aug Sep Oct Nov Dec Jan Feb Mar Apr May Jun Annual
57.6 66 77.3 86 81.3 78.6 81.8 86.3 77.5 66 57.7 54.6 72.5


Homepage