Tarapoto Climate & Temperature ⛅

⛳ Tarapoto is situated in or near the tropical moist forest biome.
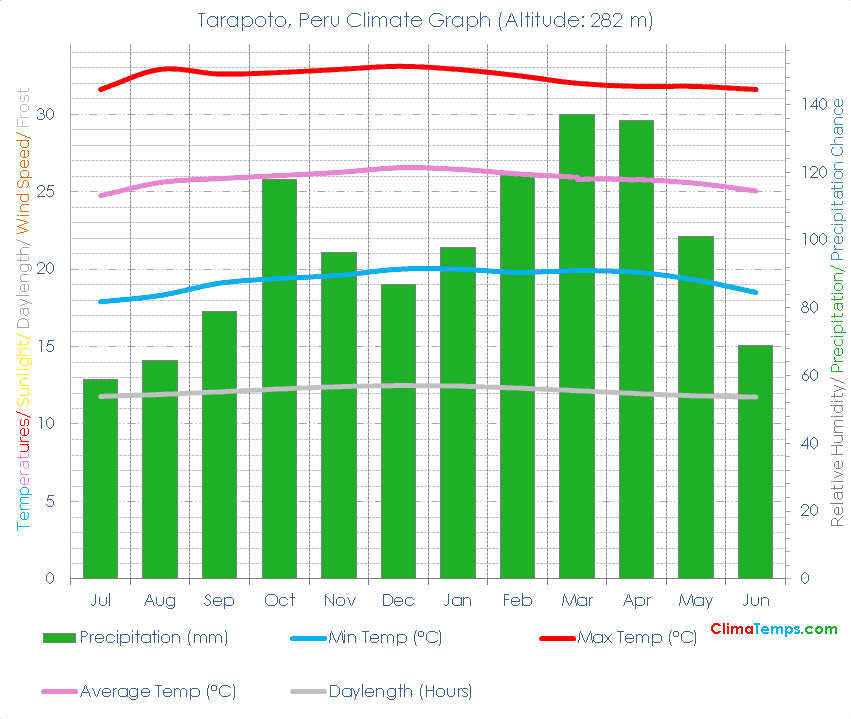
🌡️ The mean temperature is 25.8 degrees Celsius (78.5 degrees Fahrenheit). See the temperatures page for a monthly breakdown and the fixed scale graph.
🐬 Average monthly temperatures vary by 1.8 °C (3.2°F). This indicates that the continentality type is hyperoceanic, subtype extremely hyperoceanic.
☔ Total annual precipitation averages 1162.1 mm (45.8 inches) which is equivalent to 1162.1 Litres/m² (28.5 Gallons/ft²).
Embed this graph on your webpage!
Simply paste the following HTML code into your webpage. Please include a link back to this website. There is one in the following code already. Edit the width attribute to change the size of the graph if needed:
✨ The longest day of the year is 12:22 long on the 21 of December and the shortest day is 11:37 long on the 22 of June.
🐇Were you to burrow down through the centre of the Earth from Tarapoto you would pop up nearest to the climate station at Kuala Terengganu, Malaysia where you would find a Tropical wet climate.
🌍Tarapoto, Peru is at 6°30'S, 76°21'W, 282 m (925 ft). Check the location on the map.
Tarapoto Climate Table
| Jul | Aug | Sep | Oct | Nov | Dec | Jan | Feb | Mar | Apr | May | Jun | Annual | |
|---|---|---|---|---|---|---|---|---|---|---|---|---|---|
| 32 (89) | 33 (91) | 33 (91) | 33 (91) | 33 (91) | 33 (92) | 33 (91) | 33 (91) | 32 (90) | 32 (89) | 32 (89) | 32 (89) | 32 (90) |
| Jul | Aug | Sep | Oct | Nov | Dec | Jan | Feb | Mar | Apr | May | Jun | Annual | |
|---|---|---|---|---|---|---|---|---|---|---|---|---|---|
| 25 (77) | 26 (78) | 26 (79) | 26 (79) | 26 (79) | 27 (80) | 26 (80) | 26 (79) | 26 (79) | 26 (78) | 26 (78) | 25 (77) | 26 (79) |
| Jul | Aug | Sep | Oct | Nov | Dec | Jan | Feb | Mar | Apr | May | Jun | Annual | |
|---|---|---|---|---|---|---|---|---|---|---|---|---|---|
| 18 (64) | 18 (65) | 19 (66) | 19 (67) | 20 (67) | 20 (68) | 20 (68) | 20 (68) | 20 (68) | 20 (68) | 19 (67) | 19 (65) | 19 (67) |
| Jul | Aug | Sep | Oct | Nov | Dec | Jan | Feb | Mar | Apr | May | Jun | Annual | |
|---|---|---|---|---|---|---|---|---|---|---|---|---|---|
| 59 (2) | 65 (3) | 79 (3) | 118 (5) | 96 (4) | 87 (3) | 98 (4) | 120 (5) | 137 (5) | 135 (5) | 101 (4) | 69 (3) | 1162 (46) |
| Jul | Aug | Sep | Oct | Nov | Dec | Jan | Feb | Mar | Apr | May | Jun | Annual | |
|---|---|---|---|---|---|---|---|---|---|---|---|---|---|
| 11h 46' | 11h 54' | 12h 05' | 12h 15' | 12h 24' | 12h 29' | 12h 26' | 12h 19' | 12h 09' | 11h 58' | 11h 49' | 11h 44' | 12h 00' |
| Jul | Aug | Sep | Oct | Nov | Dec | Jan | Feb | Mar | Apr | May | Jun | Annual | |
|---|---|---|---|---|---|---|---|---|---|---|---|---|---|
| 63.1 | 71.5 | 82.8 | 84.2 | 76.1 | 73.1 | 76.4 | 84.8 | 82.9 | 71.5 | 63.2 | 60.1 | 74.1 |